Tuesday, 30 April 2013

Find the Volume of Irregular Objects

This was my last day at Aoki-Chuo school in Kawaguchi. My visit has been brief but has had a huge impact on my thinking - in fact I'm still thinking about my thinking, if that makes sense.

Anyway, today I was privileged to sit in on several fantastic lessons but I really want to share this one with you.


Topic - Finding Volume of Irregular 3D Shapes


Link to Previous Learning:

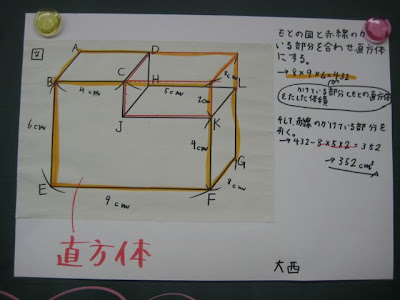
The class had been looking previously at how to work out the volume of regular cubes and rectangular prisms. The teacher presented this diagram:


There was a brief discussion about this shape along the lines of how it was similar to and different from the previous shapes that the class had worked with. Everyone seemed happy with what they could see.


Problem Solving Strategies:

Then the teacher asked them for some strategies to deal with this shape.

Two students had ideas:

1. You can separate the shape into smaller parts

2. You can add different bits of the shape together

Even though expressed differently, I think both ideas showed that the kids were looking at the composition of the shape and demonstrated their knowledge of how smaller shapes can be combined to make bigger shapes. This is something that they had done previously in Year 4 with 2-dimensional shapes.


Working Independently:

The class quickly got down to work. To save time, the teacher had prepared multiple copies of the diagram, drawn to a scale of 1:1. This was really helpful - no time spent on doing activities that were not related to the topic. Yes - drawing shapes is a great skill to learn - but not in this lesson. The focus here was always going to be on finding the volume.

The teacher circulated and talked with different children. Once they had a solution, they were encouraged to get another copy of the diagram and work it out another way.


Presentation:

The teacher selected several children who had different strategies and asked them to prepare a presentation for the class. This involved getting some A3 paper with a copy of the diagram (already prepared by the teacher) to write up their solution.


Method 1:


A simple cut divides the shape into two manageable pieces. Works well and gets an accurate solution. 

Note the use of colour in the diagram to highlight the relevant calculations. This was done by the teacher after the presentation when she was clarifying with the students what was going on.


Method 2:


In this solution, the student decided to chop off the top part and add it to the end of the remaining rectangular prism. This works neatly because the base of the chopped off part is 4cm x 6cm, same as the end of the bigger rectangular prism. Neat match! 

There was some confusion and almost disbelief - some students wanted clarification on how this worked.

So the teacher pulled out a model of the shape to show them.


I think she was holding back on showing this model because she didn't want to shape the children's thinking. Personally, I think I might have got the model out earlier or at least got the kids to make the model for themselves BUT making models wasn't the point of the lesson - everything points back to the topic: "Finding the volume of irregular 3D shapes."


Method 3:


This method starts by working out the volume if there was no missing part and subtracting the piece that is gone. Notice once again the use of colour (by the teacher) to show which part of the calculation relates to which part of the diagram.


Same and Different:

This part of the conversation is always interesting. 

The two things that children identified were:

1. You had to use multiplication

2. You had to find rectangular prisms


Generalisation:

"You can find these volumes by looking for cubes and rectangular prisms." 
- a very rough translation from the Japanese


So the students now had a strategy to deal with similar problems. The focus wasn't on getting the number answer correct, in fact it was only peripheral to the conversation.


AND

THE WAS NO MENTION ANYWHERE OF A FORMULA.


I think this was pretty significant - that's why I put it in caps


Saturday, 27 April 2013

Finding Area By Combining Shapes

I have been visiting Aoki-Chuo school in Kawaguchi, Japan this week as part of the "World Tour of Maths".

It has been an amazing experience. I have been treated like a rock star. The staff and students have been so friendly and helpful. What a great school!


Cut To The Chase


Anyway, one of the lessons I was watching involved Year 6 working out the area of shapes by looking at the shapes they are made up of.

Now, we are not talking about two triangles make a square here.

We are looking at finding an area like this:


Problem Solving the Japanese Way


One of the things I was seeing in Japanese classrooms was the way the students were encouraged, even expected, to find multiple ways to solve a problem.

Here are four ways that one student demonstrated that found the area of the shape:


Method 1


He works out that a quarter of a circle overlapped on another quarter circle makes the required overlapped shape.

So he calculates that two quarter circles have a combined area of 157cm2.

If you subtract the area of the square, you will have the overlapping shape remaining.

157cm- 100cm= 57cm2.


Method 2


In this one, he works out the area of the entire circle, subtracts this from the area of the bigger square and gets the area of the four corner pieces. This he divides by 4 to get the area of one corner piece. Then he multiplies by 2 and subtracts this total from the area of the smaller square to get the required solution.


Method 3


This time he uses a triangle and sees that the difference between the area of the triangle and the area of the quarter circle will give him half of his required shape. 


Method 4


His final method is to subtract a quarter circle from the square to get the outside corner piece. This he doubles and then subtracts from the square to get the internal shape.


What next?

Well, after they had time to work independently on their solutions, the teacher selected a few students to come and present their ideas to the class. The presentation is a very important part of the lesson and the children take it very seriously. The get a few minutes to draw their solution on some A3 paper and then stand up and talk about it. At the end they say something like, "This is what I have found to be true." and the class responds, "I agree." Then they ask for any questions, which they answer. Then they are thanked by the teacher and get a round of applause from the class.

After all the selected children had presented their solutions, the teacher left their diagrams on the board and asked the class to find similarities and differences between the various methods. This was important because the final step was to make a generalisation, a statement that could be used to help solve similar problems in the future. It is like the class summarising their learning for the lesson.


So what?


I was blown away. In the space of 45 minutes the class answered one question.

It wasn't 57 different questions from the textbook. It was one question.

But the depth of learning was very impressive. 

And at the end of the lesson, the purpose was manifestly clear - it was all about thinking.

Quality not quantity.


Tuesday, 23 April 2013

Pythagoras? When Will I Ever Use That?


You've all heard kids say it before in a lesson.

"When am I ever going to use that in real life?"

And this applies to lots of things where there's a formula or a bit of algebra and some abstract thinking.

Well, yesterday was Sunday and I was looking to find a church somewhere in San Francisco that I wanted to visit. I found it on a map. It is called the City Church on Sutter St - great church by the way if you're looking for somewhere.

Anyway, looking at the map, I had a few choices. I could go straight down Jones Street until I hit Sutter Street and then turn right (the red line).

Or I could take the hypotenuse (the green line) - much shorter!


This wasn't some clever mathematical calculation - it is just common sense. The hypotenuse is going to be shorter.

But how much shorter?

Well, if each of the other sides is about 2.5kms, then....


a2 + b2 = c2

2.52 + 2.52 = c2

c2 = 6.25 + 6.25

c2 = 12.5

c = 3.5


So I saved myself about 1.5km but cutting along the hypotenuse. 

Of course, I couldn't exactly go straight along the green line - there were houses and things in the way. My path looked a bit more like this:


Still, pretty sure it saved me some time. I got there 45 minutes before it started - which was good because I hadn't written down the exact address so I needed to walk around a bit to find the actual building. 


Well, who would have thought to look in the Russian Centre building?


POSTSCRIPT:


After posting this story, there was a certain frenzy on Twitter with several astute minds asking about the conclusions I had drawn - thanks          and any others I forgot to mention

The concerns raised were specifically:

  • Was the green route actually any shorter? - because it looks like it has the same vertical and horizontal distances as the red lines
  • If I was driving, did I take into account the number of left hand turns I would need to do that might slow me down
  • Were there any red lights I had to stop for?
  • And how much stopping and starting would you do if you had to make all those turns?
  • And what would that do with your mileage? 
Well, I was walking and got to cut a few corners but I take the point. Even though the green path is fractionally shorter when you walk it (by cutting the corners etc), it certainly isn't the same as going in a straight line.

And I certainly didn't save 1.5kms by doing it.

Oh, for the wings of a dove....


Monday, 22 April 2013

It's a matter of perspective

As I was walking around San Francisco - up and down all those hills - I came across this weird looking house.

Now why would they build a house on an angle like this?


Of course, it's just a matter of perspective really.

This is how the house actually looked.


Made me reflect on my own perspectives. 

Do I make judgements unthinkingly, based on my own biases and prejudice? How do I approach teaching my kids? Am I looking at the picture straight? Or am I distorting things to fit my own point of view?


Friday, 19 April 2013

Divide a Square in Half

Some time last year, I got my Year 4 class to divide a square in half and see how many ways they could do it. We had a lot of fun.

So there I was sitting in my first session at the National Council for Teachers of Mathematics (NCTM) conference in Denver this morning. 

The session was titled "And The Area Is...Because!" and the presenters were Kathleen Fick and Nicola Edwards-Omolewa.

The session was fantastic. I loved it.

And the first activity set the pace. 

We were given pieces of paper - origami squares - and asked to fold it in half.

How hard could that be? And how many ways could there be?


Here are some of the ways 

- I'm sure there are more!


See how many you can work out!


Here is the original origami square - you can see some of the folds I used for one of the shapes.


Here is a hexagon - the fold lines might help you see how it is half of the original square


The house - simple yet effective


Square - explain this to the kids in terms of fractions of the whole!


An octagon - not regular which I find annoying - I'm still working on a regular one


The kite - very nice combination of triangles


Isosceles triangle - very nice


Parallelogram - hint: the two short sides were edges of the original square


Trapezoid - this one my 4th graders showed me last year. 
As one of the boys said, "Any straight line that goes through the middle of the square will cut it in half!"


Wednesday, 17 April 2013

Measure Twice, Cut Once

Any builder, or patchworker, or person who deals with things that are sold by the length, will tell you this old saying is true: "Measure twice, cut once."

I have arrived in Denver, Colorado to attend the National Council for Teachers of Mathematics (NCTM) Annual Conference later in the week. Since is was freezing outside and everything was covered in a thick layer of melted slush, I decided to take a tour of the State Capitol building.

Denver, as you may be aware, is known as the Mile High city, given its height above sea level. This fact is advertised in every second shop you pass and on all of the t-shirts and tourist paraphernalia on sale in the mall.

Anyway, part of the tour of the building took us to the stairs at the front of the building where the official brass plate showing the actual height of one mile above sea level is located - well, two brass plaques and a stone engraving. And they're all on different steps.

In 1909 when the building was completed, it was decided to mark where the actual "one mile above sea level" was so the inscription was made on the 15th step.


The 1909 engraving

In 1969, someone decided to check the accuracy of the first measurement and found that it should have been on the 18th step, so a brass plaque was installed on that step.


The 1969 brass plaque


This was again checked in 2003 using GPS technology, which found that the actual marker should be on the 13th step, so a new brass plaque was put in.


The 2003 plaques - and you can just about see the other
indicators in the background


And the way global warming is going, in 50 years time the marker will need to be somewhere up near the top of the dome...


Monday, 15 April 2013

Using Art to Inspire Maths

As part of the "World Tour of Maths", I have spent the last week in New York visiting some schools. It has been a great opportunity to visit some classes and meet some teachers.

And yesterday, I got to visit two of the world's greatest art galleries - The Metropolitan Museum of Art and The Guggenheim Museum.

And after about 5 minutes, I started to think.

"How could I use art to inspire maths in my classroom?"

So, here are a few pictures.

How could you use them in your classroom to get a conversation started about maths?


Homage to the Square: Soft Spoken
Josef Albers


Large Blue Horizontal
Ilya Bolotowsky


Second Theme
Burgoyne Diller


The Bargeman
Fernand Léger


13/3
Sol LeWitt


Composition 8
Vasily Kandinsky 


Rome
Anthony Hernandez


One Million Kingdoms
Pierre Huyghe


And here's an idea...

Maybe you could build up a portfolio of pictures of artwork that stimulate and provoke mathematical conversations with your class.