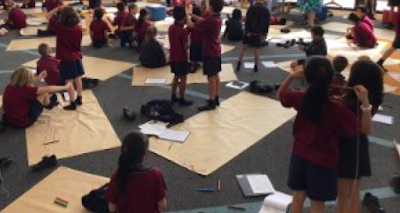
We got all 120 of the Year 4 students to complete the Maths Attitude Survey last week. (My dream is to get the whole of the school to do it, but we crawl before we walk...)
I thought it would be interesting to look at their results so I got them to complete the survey as a Google Form. 113 out of the 120 completed it.
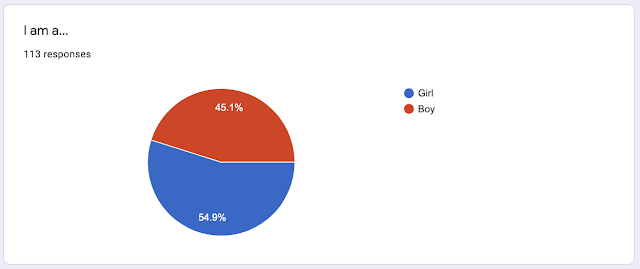
Here are the results:
So we had more girls complete the survey than boys.
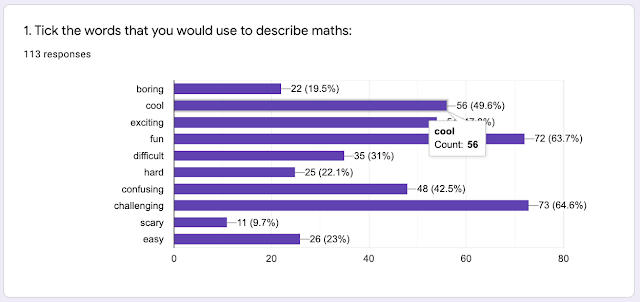
Interesting - we still some very positive words being chosen to describe maths. "Fun" was right up there but the No. #1 word of choice was "Challenging". We had a talk about that. The kids thought that this was a word that described maths as being something worthy of effort and rewarding when they succeeded with a puzzle or problem.
"Scary" was rated very low (good!) but 22 students (19.5%) still chose "boring". This may have been a result of having all 120 kids complete the digital survey together - there may have been some contamination of data. Or maybe this is really what they think.
What would you choose to do all day? Art or reading or drama. Maybe this says something about our creative clientele. Maths comes in at #7. (UOI is Unit of Inquiry - we are a PYP school. Surprised this ranked so low.)
And so, on to some questions about explicit maths:
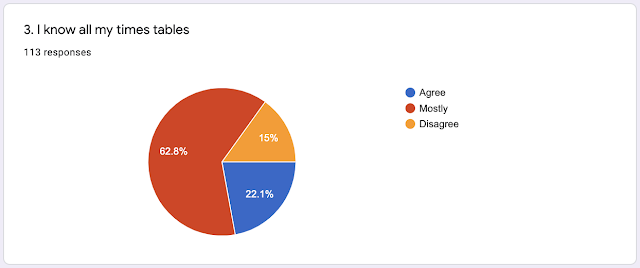
- Not too bad at multiplication...
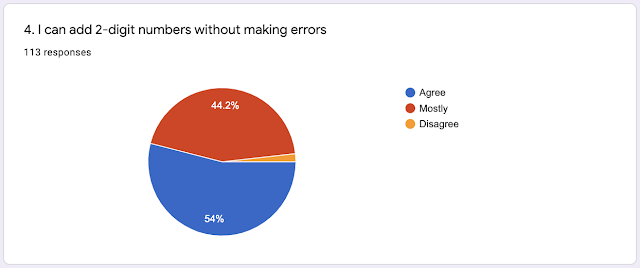
...Very confident with 2-digit addition...
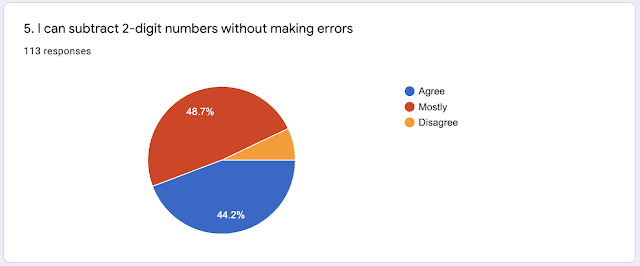
...Subtraction not too bad...
...Division is a bit less certain...
... Fractions is equally uncertain...
... Converting fraction to percentages - not good...
... Measurement - surprisingly not confident. I thought this would be scored higher. Lots of "mostly".
Then we got to Question 10. Rate yourself on the scale (1-10) to show where you would be:
On the original survey, students had to draw a cross on the line to show where they thought they would be. On the digital version, I was limited by the fact that I could only give them a maximum of 10 boxes to choose from.
But the results were even more revealing. Here is the data from all of Year 4:
In terms of numbers, almost 60% of our boys rate themselves 8 or above.
In contrast, less than 16% of girls rate themselves 8 or above.
And then, 42% of girls rate themselves 5 or less whereas about 14% of boys rates themselves 5 or less.
This is huge. These kids are only 9 years old, turning 10. How do they get these ideas about themselves?
Much work to be done on mindset.
Thursday 27 February 2020
Thursday 13 February 2020
Exploring Ratios Reveals the Distributive Law
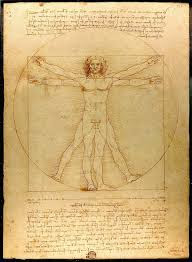
We had been doing an investigation into Vitruvian Man this week. You know, the picture that Leonardo drew:
A fascinating picture with a fascinating story.
Anyway, all the scribble around the outside of the picture is actually Leonardo's mathematical calculations based on the ratios of the human body.
Did you know that, in the "ideal" human body:
- a palm is four fingers
- a foot is four palms
- a cubit is six palms
- four cubits is the height of a man
- a pace is four cubits
- a man is 24 palms tall
- the length of the outspread arms is equal to the height of a
man.
- from the hairline to the bottom of the chin is one-tenth of
the height of a man.
- from below the chin to the top of the head is one-eighth of
the height of a man.
- the maximum width of the shoulders is a quarter of the
height of a man.
- the distance from the elbow to the tip of the hand is a
quarter of the height of a man.
- the distance from the elbow to the armpit is one-eighth of
the height of a man.
- the length of the hand is one-tenth of the height of a man.
- the foot is one-seventh of the height of a man.
- from below the foot to below the knee is a quarter of the
height of a man.
- the distance from below the chin to the nose is equal to:
- The distance from the nose to the eye brows
- The distance from the eyebrows to the hairline
- The length of the ear
- One third of the face
Well, didn't we have a lot of fun exploring all these ratios and proportions!
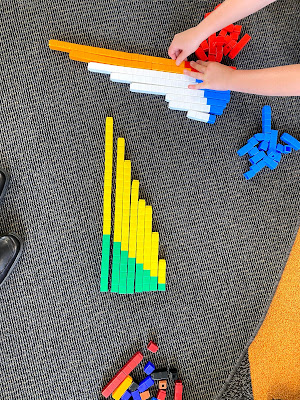
So the next day, I took it in another direction. We hadn't played with blocks much this year, so I got some out and asked a few provocative questions:
- Get one block
- Get two blocks of a different colour
- Get two blocks of the first colour
- Get four blocks of the second colour
Continue.
How much are you increasing by?
How many blocks of colour #2 do you need if you start with 6 blocks of colour #1?
This was to look at what happens when you use ratios to increase a given value.
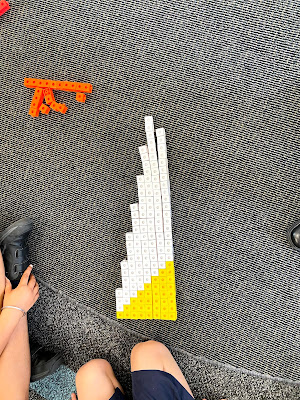
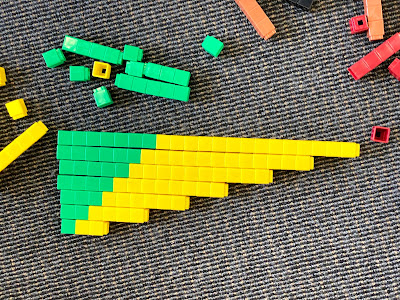
Here is what the kids did:
You can see what is happening here.
1 green + 2 yellows = 3 blocks
2 greens + 4 yellows = 6 blocks
3 greens + 6 yellows = 9 blocks
and so the pattern grows...
But if we look at the greens as being our 1x tables (1, 2, 3, 4...) and the yellows as being our 2x tables (2, 4, 6, 8...) then when we add them together we get the 3x tables! (3, 6, 9, 12...)
We tried this with 1x and 3x:
1 green + 3 yellows = 4 blocks
2 greens + 6 yellows = 8 blocks
3 greens + 9 yellows = 12 blocks
And it worked. (1x tables) + (3x tables) = 4x tables
"So what might be another way to work out your 4x tables?" I asked.
Quick as a flash, one bright young thing said, "2x tables plus 2x tables."
And he was right.
The Distributive Law in action.
Friday 7 February 2020
Start the Year with an Attitude Survey
Here in my part of Australia it is the end of Week 1, Term 1. Being a good teacher, I am always keen to get to know my new class quickly and to find out all about them.
And this often involves assessment.
Kind of sad if the first words of greeting are, "Hi kids! Did you have a great holiday? Sit down and do this test."
Really, doing tests in Week 1 is harsh. But I still want to know about my kids.
So instead, I give my students an attitudinal survey so they can tell me how they "feel" about maths.
I am teaching Year 4 this year. They are some of the kids I taught in Year 2 back in 2018 who did the awesome patterns you may have seen on my blog from back then. So I was hopeful that there would be some pretty strong connection happening with maths.
I don't have room to go through the whole 2 pages of the survey (if you want a copy I can email you one) but I want to highlight a few interesting questions and the results from my class.
Question 1
Put a circle around
the words you would use to describe
maths:
boring cool exciting fun difficult
hard confusing challenging scary easy
Results for Question 1
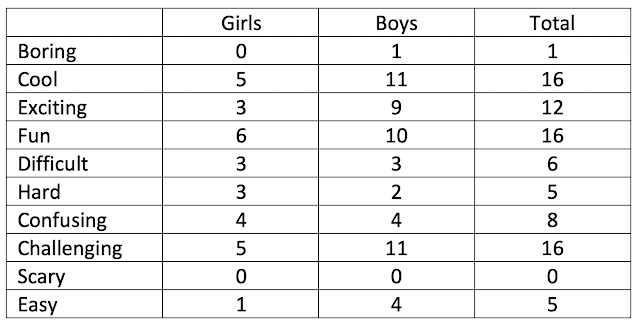
Students could circle as many words as they wanted to. This is how the students in 4BF responded:
Interesting.
No-one in my class finds maths scary - or maybe they're too scared to admit it.
The most frequently recorded words were "cool", "fun" and "challenging". This is very positive language. Even "challenging" acknowledges that maths can require effort but that this is seen as a challenge rather than as being simply "difficult".
The one boy who circled "boring" also circled "hard", "difficult", "challenging" and "confusing". He is not a student that I have taught before. He will be at the top of my list to learn more about and to see where we can make some positive gains.
I wonder if the students will still be using the same language at the end of the year?
Another question that I use asks the students to rate their own ability at maths by putting a cross on a line. It looks like this:
Question 4
This example is my "boring" boy from the question above. Definitely need to get involved here.
The length of the line is 15cm (or 150mm). With this question, I measure the position of the cross in relation to the left hand end of the line and give a score our of 150 (because the line is 150mm long, so 1 point equals 1mm).
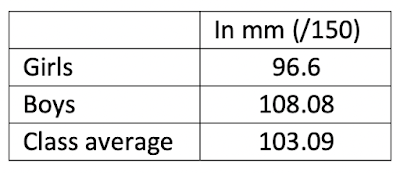
Results were:
So the boys rate themselves pretty highly at maths, even given the "outlier" (above) who scored himself at about 25 out of 150. And the girls have a (significantly) lower opinion of their abilities. Do the boys have an inflated sense of how "good" they are? Are they being realistic? Are the girls too modest? Are they being realistic? Do they doubt themselves?
One thing that does stand out - I need to work on attitude.
This quick survey gave me a lot of information to think about - probably more than a skills-based number test would have. There were 10 questions in all. Some questions were similar in format to the above, others were short answer and required sentence responses. I can highly recommend that you have a go at doing something similar to start your year. It will tell you a great deal about the students in your care.
All 5 of our Year 4 classes did this survey. Hopefully in the next few days I will have data from all the classes that I can share.
Have fun!
Subscribe to:
Posts (Atom)
