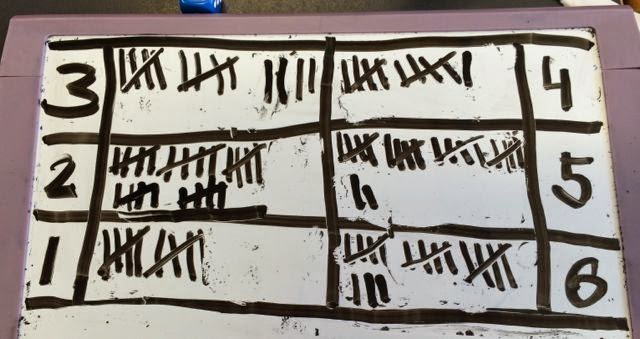
First thing we looked at was rolling dice. Each number has an equal chance of being rolled. How would this play out with 100 rolls? And then if we added the 100 rolls from 24 students?
So we got to work. Would the numbers come out evenly?
Here's some data recording:
This one looked a bit random - the numbers are in a strange order -
but it works.
A bit untidy but you get the idea.
So, did you record 100 rolls? Let's see if that adds up...
Don't you just love girls? They are soooo organised!
And once we had data, we needed to display it as a graph so that we could see our data clearly:
Yep - beautiful presentation, accuracy, colour, neatness...
So we then combined all our data and put together the results on Excel.
You will notice that 24 students rolling a dice 100 times each gave us a total number of dice rolls of .... 2419?
Much discussion followed about why we got these results. Why weren't they all even? Why was "3" so low? Why was "2" so high? How could we do it differently?
Next we made some spinners. This was a bit of fun. Simple to make as well.
I printed off some hexagon shapes which we stuck onto cardboard, coloured in different ways (one spinner unequal chances, one spinner equal chances, one free choice) then stuck through a tooth pick.
You will notice that 24 students rolling a dice 100 times each gave us a
total number of dice rolls of .... 2419?
Much discussion followed about why we got these results. Why weren't
they all even? Why was "3" so low? Why was "2" so high? How
could we do it differently?
Next we made some spinners. This was a bit of fun. Simple to make as
well.
I printed off some hexagon shapes which we stuck onto cardboard,
coloured in different ways (one spinner unequal chances, one spinner equal
chances, one free choice) then stuck through a tooth pick.
Here's the template we used
Here's what mine looked
like
The kids were so much more creative than me...
And then we had to invented some games of chance. Here's a few
action shots of games in progress:
And a lot of fun was had by all.
It's simple. It's easy. It relates to the Australian Curriculum:
List outcomes of chance
experiments involving
equally likely outcomes and
represent probabilities
of those outcomes using
fractions (ACMSP116)
All good.


they use to organise groups of objects and how they can show this grouping and explain what they have done. inquiry
ReplyDelete