Friday 17 May 2013

Inquiry into Graphs and Data

Well, first week back from "The World Tour of Maths" and Tina the Awesome from next door had our classes sorted for the week. We were going to launch into an inquiry into graphs and data. Here's how it looked - you may see some references to Australian Curriculum here:


Inquiry - How I am going to organise this data?


An inquiry into - how we can collect, organise, represent and draw conclusions from data.

Skills - Addition; Subtraction; Collection of Data; Graphs

Learning Intention - Collect and organise data and draw conclusions. To understand data can be represented in different ways and some ways are more appropriate than others.

Success Criteria - 

  • Select and apply efficient mental and written strategies and appropriate digital technologies to solve problems involving all four operations with whole numbers (ACMNA123)
  • Interpret and compare a range of data displays, insulting side-by-side graphs for two categorical variables (ACMSP147)

Teacher Questions - 
  • What is the percentage of people in Australia are aged 0-14 years?
  • What is the percentage of people aged 0-14 years in 9 other countries?
  • How do these countries compare with Australia?

Student Questions - 

Children generated 3 questions of their own.


My plan - 

Children devised a plan. How were they going to get answers to these questions? What strategies would they use? How would they represent their information?


Basic equipment I will need - 

Students made a short list of equipment they were going to use.


Running the Inquiry


So, we launched into the inquiry. 

Our chosen data source was the World Fact Book on the CIA website - lots of data on lots of countries, and population data had age categories including 0-14 years. Convenient huh? You would almost think Tina had organised this...


Anyway, lots of discussion, lots of planning, lots of collaboration and lots of fun.

Here are a few work samples from the kids:


We started by collecting data and putting it into a table


A bar graph  - courtesy of Microsoft Excel


A simple column graph - the simple things in life are often the best


A line graph - this generated lots of discussion. Is it the right type of graph for this data?


A pie graph - took ages to work it out but looks very busy.
Can too much information be a bad thing?


Reflection - What did the kids say?


All good inquiries allow space for reflection. We had a few questions as prompts to get the kids to write about some of their experiences - the choices and decisions they made. Here are a few comments from them: 


Which graph was the best type to represent our data?

"I think maybe a bar graph would have been the best choice because you can accurately see the results of the data."

"I found that a column graph was the best to represent my data as it was easy to read and simple to make and information was clear to represent. Here's why: the height of the columns are identifiable and variable, while the vital points on the side containing numbers and/or percentages as a part of information extending knowledge of the topic."


Why is one type of graph better than another?

"All types are good in their own way and it depends on what data you have. Different graphs are useful for different things."


What would you do differently next time?

"I drew a bar graph. This was a good decision because people will understand and interpret my data better. Next time I would do nothing different. I am proud of my decision and I will stick with it."

"I drew a pie chart. This was probably not a good choice because there was too much data to be shown and it would not give the person reading it a fast, visual impact. Next time I would draw a bar or column graph because it would be easier to compare the data and it would be clear and quick to read."

"The column graph was much clearer to read than a pie or line graph in the situation we used it but it depends on what sort of information you need to show."

"The graph I represented my data with was a line graph. This was not a very good choice because line graphs are supposed to show results over time. Next time I would use a bar graph because it can clearly show the data."


So what?


Well, you heard it from the kids. They know that different graphs have different purposes. They know that their decisions will determine how effectively they communicate their data. And it all links back to the learning intention.

Great stuff.

Can't wait for next week...


Saturday 11 May 2013

Singapore MRT Puzzle

This post is dedicated to a young friend, E. P. Dubs, who is developing quite a passion for the SIngapore train network...

...and consequently got me thinking.


The Challenge


Starting anywhere you want, travel on a continuous path and go through every station on the map.

What is the least number of stations you will have to pass through more than once?


If this is too hard to read, you can probably Google your own


So, I think I have a solution but I'm not going to tell anyone.

You have to think for yourself.

To extend this idea, you could:

1. Choose a mandatory starting point, such as Changi Airport or Dhoby Ghaut.

2. Say you can only travel on the red and yellow lines in a clock-wise direction.

3. Use the maps for other underground railway networks, like London, Paris, New York, Tokyo....or anywhere you want!

Good luck!


London


Paris


Tokyo


Wednesday 8 May 2013

Nextian Number Theory

Another brilliant development of mathematics, Nextian Number Theory, appears in Jasper Fforde's book, "Something Rotten.".


The artwork on the covers of this edition of
Fforde's books is exceptional


In this part of the story, Thursday is again talking with her Uncle Mycroft, the inventor. He has been thinking about working backwards from solutions to find out what the question was. He calls this "Nextian Number Theory":


'What work were you presenting to MadCon '88?'
'Theoretical Nextian mathematics, mostly,' replied Mycroft, warming to the subject dearest to his heart — his work. 'I told you all about Nextian geometry, didn't I?'
I nodded.
'Well, Nextian number theory is very closely related to that, and in its simplest form allows me to work backwards to discover the original sum from which the product is derived.'
'Eh?'
'Well, say you have the numbers twelve and sixteen. You multiply them together and get 192, yes? Now, in conventional maths if you were given the number 192 you would not know how that number was derived. It might just as easily have been three times sixty-four or six times thirty-two or even 194 minus two. But you couldn't tell just from looking at the number alone, now, could you?'
'I suppose not.'
'You suppose wrong,' said Mycroft with a smile. 'Nextian number theory works in an inverse fashion from ordinary maths — it allows you to discover the precise question from a statedanswer.'
'And the practical applications of this?'
'Hundreds.' He pulled a scrap of paper from his pocket and passed it over. I unfolded it and found a simple number written upon it: 2216091 -1, or two raised to the power of two hundred and sixteen thousand and ninety-one, minus one.
'It looks like a big number.'
'It's a medium—sized number,' he corrected.
'And?'
'Well, if I was to give you a short story of ten thousand words, instructed you to give a value for each letter and punctuation mark and then wrote them down, you'd get a number with sixty-five thousand or so digits. All you need to do then is to find a simpler way of expressing it. Using a branch of Nextian maths that I call FactorZip we can reduce any sized number to a short, notated style.'
I looked at the number in my hand again.
'So this is?'
'A FactorZipped Sleepy Hollow. I'm working on reducing all the books ever written to a number less than fifty digits long. Makes you think, eh? Instead of buying a newspaper every day you'd simply jot down today's number and pop it in your Nexpanding calculator to read it.'
'Ingenious!' I breathed.
'It's still early days but I hope one day to be able to predict a cause simply by looking at the event. And after that, trying to construct unknown questions from known answers.'
'Such as?'
'Well, the answer: "Good lord, no, quite the reverse!" I've always wanted to know the question to that.'
'Right,' I replied, still trying to figure out how you'd know by looking at the number nine that it had got there by being three squared or the square root of eighty-one.
'Isn't it just?' he said with a smile, thanking my mother for the bacon and eggs she had just put down in front of him.


from "Something Rotten" by Jasper Fforde

Monday 6 May 2013

Nextian Geometry

I've been doing a bit of reading lately. One of my favourite author's is Jasper Fforde, very funny speculative fiction writer. I would like to publicly thank my colleague and friend Jane Stanton, school librarian extraordinaire, for pointing me in his direction. If you haven't read any of his works, do yourself a favour.


Jasper Fforde - worth reading


Anyway, I'm currently reading "Lost in a Good Book". Our hero, Thursday Next, is talking with her inventor uncle Mycroft. Polly is Mycroft's wife, Thursday's aunt.


"This is Polly's hobby, really. It's a new form of mathematical theory that makes Euclid's work seem like little more than long division. We have called it Nextian geometry. I won't bother you with the details, but watch this."
Mycroft rolled up his shirtsleeves and placed a large ball of dough on the workbench and rolled it out into a flat ovoid with a rolling pin.
"Scone dough," he explained. "I've left out the raisins for purposes of clarity. Usingconventional geometry, a round scone cutter always leaves waste behind, agreed?"
"Agreed."
"Not with Nextian geometry! You see this pastry cutter? Circular, wouldn't you say?"
"Perfectly circular, yes."
"Well," carried on Mycroft in an excited voice, "it isn't. It appears circular but actually it's a square. A Nextian square. Watch."
And so saying he deftly cut the dough into twelve perfectly circular shapes with no waste. I frowned and stared at the small pile of disks, not quite believing what I had just seen.
"How--?"
"Clever, isn't it?" he chuckled. "Admittedly, it only works with Nextian dough, which doesn't rise so well and tastes like denture paste, but we're working on that."

Jusper Fforde from "Lost in a Good Book"


There is more to come. When I find the other mathematical ideas (there are several) I will post them as well.

In the meantime, get down to the library and borrow a few of Fforde's books to read for yourself.

Saturday 4 May 2013

4-Steps with Polya

Here is an example of problem solving from a school in SIngapore. The school uses a 4-step problem solving model based on the work of George Polya, a common model in Singapore schools.


George Polya - Hungarian born mathematician
interested in problem solving


The 4-step model goes like this:

Step 1 - Understand - what I know

Step 2 - Devise a plan

Step 3 - Solve the problem by carrying out the plan

Step 4 - Check to see if you have in fact solved the problem


Solving a Problem


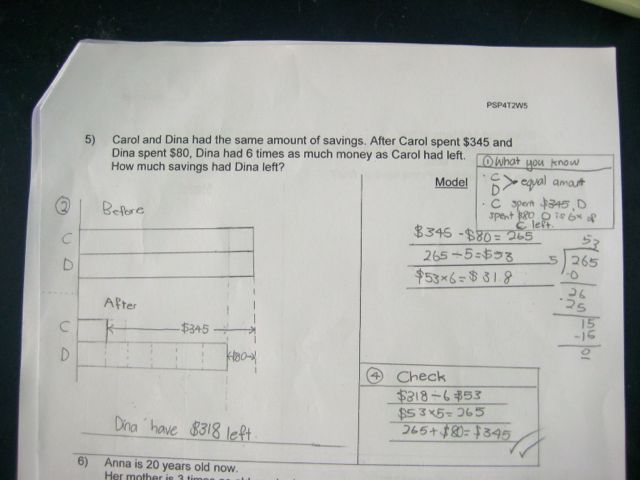
So, here's the story. Carol and Dina start with the same amount but at the shops Carol goes crazy and splurges to the tune of $345. Dina, a veritable model of restraint, only spends $80. 

Our student uses the 4-step model beautifully. 

Step 1 - here's what I know, the facts from the story

Step 2 - really interesting that our student decides to use a "before and after" representation. This is a nice way to represent the story given that it is told in a "before and after" style. Nice strategy.

Step 3 - is the calculations in the "Model" column but also represented in the diagram in Step 2

Step 4 - yep - student has checked by substituting back into the story. By working backwards they end up with the starting amount - all good!!


Same story, new student. 

Note that this student goes straight for the jugular. Not needing to show the starting point, this student focuses right on the question of how much cash is left?

In fact, they didn't really need to know how much Dina and Carol started with. The calculation in Step 3 got them there:

$53 x 6 = $318

The other bit in Step 4 is probably superfluous.

But some very nice application of the 4-step model.


So What?


I am getting the feeling that having a system for solving problems is a useful tool. 

Polya's 4-step idea is not that dissimilar from the 9 steps I saw in the school in Japan. 

The beauty of both models is that they are general enough to provide a framework that is useful in a variety of contexts but not so general as to lack practical application.

Stay tuned - I feel a "Ferrington" model can't be far away....