Mathematics for Elementary Teachers - an activity approach
The Task
So the task was to get a 16 x 16 grid and make a series of regular prisms that have a square base.Here's what it looked like:
Shape 1 = 14cm x 14cm x 1cm
Shape 2 = 12cm x 12 cm x 2cm
Shape 3 = 10cm x 10cm x 3cm etc
The kids were able to see a pattern emerging. Each time you increased the height by 1cm, the sides of the base decreased by 2cm.
They were able to construct a series of 7 shapes:
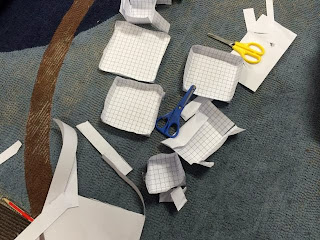
Yes - it got a bit messy...
Eventually we all had a set of shapes.
What Next?
The task then was to arrange these shapes in order from smallest to largest without actually measuring them or doing any calculations.
Here's what a few pictures of what the kids thought...
To help us discuss the activity, we decided to name each shape after its height. So Shape 1 has a height of 1cm, Shape 2 had a height of 2cm etc.
Here are a few comments from the kids about what they noticed when they tried to order the shapes:
-->
We think they are all the same.
Shape 1 would be the largest because it is
long and has the space of the tallest one. I’m just wondering if they would
almost be the same since they has the same squares building it.
I reckon if you have a smaller base the
sides get bigger. If you get a bigger base you get smaller sides. The one with
the biggest base is the biggest shape because you are losing squares each time
you fold the edge up.
I’m not exactly sure about Shape 6
Having the biggest base doesn’t mean you
have the biggest capacity. Just like if you have the tallest height it isn’t
going to have the biggest capacity.
I found this really interesting because I
thought that shape 4 was going to be the biggest. I also found it interesting that we used the
same sized piece of paper for every shape.
I found that the largest shape in length
isn’t necessarily the shape that has the largest volume.
I found it interesting because the capacity
of the shape went up then down. I thought that Shape 4 would be the biggest
because it had a big area (base) and was quite high.
I found that the tallest shape will not necessarily
have the larger amount of volume.
Doing Some Calculations
So finally we decided to do actually work out the capacity of each shape. Some kids chose to use some of the base-10 blocks to work this out.When we had finished, we drew up a table of data:
Now this was really interesting. Starting with Shape 1, the capacity increases for Shapes 2 and 3, then it starts to go down. This is not what any of us was expecting.
Then we began to wonder.
Is the height of 3cm going to give us the biggest capacity?
What if we try 3.1cm? Or 2.9cm? Will they both be smaller than 3cm?
So we did a bit a table:
And constructed a graph of this data:
And that was really interesting.
And the kids started asking, "What if we try somewhere between 2.6cm and 2.7cm? What about 2.65cm?"
Maybe you can try that one at home....
Don't you love the inquiry mindset?


Hi,
ReplyDeleteJust wondering how to managed to figure out the volume for the second table?
The pattern of the formula obviously changes once you go into decimal places so I'm not sure how you find the length & width....
Thanks in advance!
Hi Miss Ford - this was a while ago but I think we were still using the 16 x 16 grid. Therefore, if the height was 2.9cm, we could work out what the dimensions of the base would be (10.2 x 10.2cm). From this, we could then work out the volume (10.2 x 10.2 x 2.9 = 301.716). Hope that's right...
ReplyDelete