Monday, 16 December 2013

Christmas Bells

It's nearly Christmas.

And for the 10 days leading up to Christmas Day you can go down to St Andrew's Presbyterian at State Circle and ring the bells each evening. If you are interested in finding out more about the bells, click here. 


Anyway, we were there last night and the kids had a go with the bells. I wanted to show you the set up - it's very mathematical.

There are 8 bells. Each has a rope attached to it and the ropes are numbered. 


To play a song on the bells, the tunes are written out as a series of numbers - good for the pitch but doesn't give you any idea of the rhythm if you don't know the tune.

Here are a few samples:


There were quite a few people there having a go. It was lots of fun. And applied our number skills in the process.


If I don't get back on to the blog in the next week, have a great Christmas and see you all again next year.

Big things are planned for 2014 - including learning to play the bagpipes - so stay tuned for more great maths coming your way.


Tuesday, 3 December 2013

Australia and the 2012 PISA Results

The latest PISA results are out. By tomorrow morning the Australian newspapers will be running stories on how badly we did, why we failed and when we should be getting back to basics.

So what did the results show?


Where did Australia rate in the world for Mathematics literacy?


Well, this table shows we came in 19th place. Good news is we are ahead of New Zealand. Looks like Finland has dropped a bit and most of the top 10 countries are located in Asia. Our spread of scores is pretty wide but not as wide as some countries including Belgium and Chinese Taipei.

Is there a difference between males and females?


The answer is a very disappointing yes. Females are not performing as well as males in this testing. We are well down the table on this one. Not a good thing for our country.


How did each state perform?


Glad to see the ACT leading the country here. In fact, if we were a country we would be only one point behind Finland and almost in the top 10. Still, we're 100 points behind Shang-hai.


Is there a difference between males and females in each state?


Yes - some states are worse than others. Not a significant difference in the ACT. 


 How about our indigenous students?


This is really concerning - a difference in scores of 90 points. This is not good enough. We cannot sit back and accept this as just the way things are.


Does where you live matter?


Sure does. Metropolitan students are way ahead of their country cousins. Seems to indicate to me that their is an inequitable distribution of resources here.


 How have our scores changed over time?


This is going to make the headlines - our scores have gone downhill steadily since 2003. Each time we have participated in the PISA assessment, we have done worse. And this is what is going to provoke outrage in the media - not the great divide between male and female, indigenous and non-indigenous, rural and urban, government and non-government. 

And how long will it take before the first journalist starts pointing a finger at teachers and apportioning blame to the profession whose members are abandoned by their elected members of parliament the minute things get hard?

(Was that too impassioned and political? Sorry - it's been a bad week for teachers and schools and I do give a Gonski...)

Anyway, stay tuned and keep a weather-eye on the media over the next 24 hours. Let's hope for some informed and enlighted voices to speak words of reason.


Monday, 2 December 2013

What did I learn in Maths this year?

On the front page of our school reports we have a section where the students have to write a paragraph, reflecting on their experience over the previous 6 months. It's a great opportunity for them to reflect on what they did, what progress they made and what they aim for next time.

Reading through the comments written by my class, I found there were lots of comments about Maths. So here is a selection of comments about what the students had to say about their learning in Maths in 2013:


Long Division


Long division was a bit of a preoccupation for Year 6 this year. The kids came in at the start of the year expecting this to be the ultimate experience of Year 6 maths. This came out strongly in their reflection comments:


One of my favorite things about this year has been long division. When I first tried it I had no clue but once it had been explained to me on how to do it I found it easy. I hope that next year I learn just as much.

I have enjoyed maths and art this semester because I liked learning about long division and long multiplication.

This year I have got a lot better at maths, learning lots of new things like long division.

Year 6 has gone so quickly but I have learnt many things. I learnt how to use a defibrillator, what happened at Cowra and how to use long division and long multiplication.

Math was the second best thing for me. I learnt how complex it really is. Long division was hard for me.


Place Value, Fractions and Decimals

This semester I have found decimals and chance in maths fun. I had fun doing chance because it was fun working in groups and completing activities. I liked decimals because it made everything a little harder.


I think I have also displayed a good understanding of long multiplication and regular multiplication.  Next year I hope to improve on my handwriting and learn how to do fractions because I just don’t understand them at all. 

Don't understand fractions at all? That's a bit of a worry...


My main strengths would be some aspects of maths like percentages, Mandarin and most things in music. My weaknesses would be most things in maths and some things UOI.


Fun, Enjoyment and Improvement


These are the ones that put a smile on my face and make me think I've done something useful this year.

I have greatly improved in my maths and I enjoy it a lot more than I used to.

I have learnt to enjoy maths because of all the activities that have been creative and challenging. Even though I still have a long way to go I think I will be more open to the new ideas of mathematics.

My goal for Year 7 is to have a deeper understanding of mathematical calculations.

Some of my strengths for this year would be P.E and maths.


I like solving maths algorithms.


Wednesday, 27 November 2013

Fun with Volume

We'd been looking at volume and capacity in class for a few days and I came across an activity in an old book that I bought for $2 at the Lifeline bookfair.


 Mathematics for Elementary Teachers - an activity approach

 The Task

So the task was to get a 16 x 16 grid and make a series of regular prisms that have a square base. 


Here's what it looked like:

Shape 1 = 14cm x 14cm x 1cm 


Shape 2 = 12cm x 12 cm x 2cm


Shape 3 = 10cm x 10cm x 3cm etc

The kids were able to see a pattern emerging. Each time you increased the height by 1cm, the sides of the base decreased by 2cm.

They were able to construct a series of 7 shapes:


 Yes - it got a bit messy...

 Eventually we all had a set of shapes.


What Next?


The task then was to arrange these shapes in order from smallest to largest without actually measuring them or doing any calculations.

Here's what a few pictures of what the kids thought...


To help us discuss the activity, we decided to name each shape after its height. So Shape 1 has a height of 1cm, Shape 2 had a height of 2cm etc.

Here are a few comments from the kids about what they noticed when they tried to order the shapes: 
 
-->
We think they are all the same.

Shape 1 would be the largest because it is long and has the space of the tallest one. I’m just wondering if they would almost be the same since they has the same squares building it.

I reckon if you have a smaller base the sides get bigger. If you get a bigger base you get smaller sides. The one with the biggest base is the biggest shape because you are losing squares each time you fold the edge up.

I’m not exactly sure about Shape 6

Having the biggest base doesn’t mean you have the biggest capacity. Just like if you have the tallest height it isn’t going to have the biggest capacity.

I found this really interesting because I thought that shape 4 was going to be the biggest.  I also found it interesting that we used the same sized piece of paper for every shape.

I found that the largest shape in length isn’t necessarily the shape that has the largest volume.

I found it interesting because the capacity of the shape went up then down. I thought that Shape 4 would be the biggest because it had a big area (base) and was quite high.

I found that the tallest shape will not necessarily have the larger amount of volume.


Doing Some Calculations

So finally we decided to do actually work out the capacity of each shape. Some kids chose to use some of the base-10 blocks to work this out.


When we had finished, we drew up a table of data:


Now this was really interesting. Starting with Shape 1, the capacity increases for Shapes 2 and 3, then it starts to go down. This is not what any of us was expecting.


Then we began to wonder.

Is the height of 3cm going to give us the biggest capacity?

What if we try 3.1cm? Or 2.9cm? Will they both be smaller than 3cm?

So we did a bit a table:


And constructed a graph of this data:


And that was really interesting.

And the kids started asking, "What if we try somewhere between 2.6cm and 2.7cm? What about 2.65cm?"

Maybe you can try that one at home....

Don't you love the inquiry mindset?


Tuesday, 26 November 2013

My Report Comments Wordle

I've finished writing my class reports so I thought I'd do a Wordle of the Maths comments.

Here it is:


So, what does this say about me as a teacher?

Well - looks like some of our big topics this year were multiplication, fractions and decimals. Division is in there too. Hmm...lots about "number", what about the other elements of maths?

Knowledge, facts and understanding are all important.

There are a few positives in there - good, excellent, confident.

I'm a bit concerned that "practical" and "relationship" both get only a small mention. Why do I not make more comments about these aspects of learning? And what about patterns? Is that in there anywhere?

Try it yourself. Plug the text from your report comments into Wordle - see what comes out the other end.

Good luck!

Thursday, 21 November 2013

Find the area of a circle......without using pi

I haven't had much time to write on the blog lately as we are busy assessing and writing reports. Don't you love end-of-year?

As part of the assessment process, we used a pencil and paper test to confirm what we were thinking about Maths skills and concepts.

We had done a bit of inquiry into find the area of 2D shapes with straight sides. We hadn't looked at circles.

So I thought I'd throw in a question about finding the area of a circle. I knew that some of the kids knew the formula so I made the rule that they were not allowed to use pi in any of their calculations.

Just wanted to see what they would do.

So here is the question:

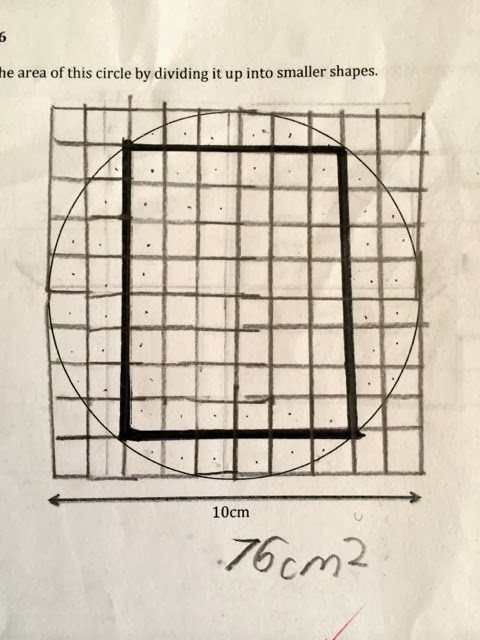
You are given a circle with a diameter of 10cm. Find the area of the circle by dividing it up into smaller shapes. (Do not use pi in any of your calculations.)

(I cheated - I used pi and got an area of about 78.54cm2..  I wanted to have some "real" value to assess the accuracy of the students and their methods against.)


And here a some of the solutions that the kids came up with...


Method 1 - Break it up


Nice idea. Using regular shapes such as squares and rectangles, we can get an approximation of what the area of the circle might be. It is a bit complicated in that it involves lots of different calculations, but the solution presented here was pretty close to our target.


Same strategy but choosing different shapes. This attempt is a bit less detailed so it loses a bit of accuracy but the end solution is also pretty close to out target. The students quickly saw that since the shape is symmetrical, some of the calculations only need to be done once then multiplied by the number of times that shape appears in the diagram.


Method 2 - Subtract the corners from a bigger square


Seeing that the circle has a diameter of 10cm, it would fit into a square with sides 10cm x 10cm. We could then subtract the "corner" triangles to get an approximation. I'm not sure that the student measures and calculated the triangle accurately as their solution was a bit out but the strategy and process was excellent.


Same general idea but this time using rectangles in the corners instead of triangles. 


Method 3 - Using a grid


This student drew up a 1cm grid and used this to count the number of squares. They worked out the number of complete squares and then added half the number of incomplete squares to get a pretty accurate result.


Using a grid for a quarter of the circle means you only have to count a quarter of the number of squares to calculate an approximate area that is very close to our target.


And finally, this student chose to use a 4cm grid to get their solution which was slightly higher than the others but definitely demonstrated a good understanding of the problem and what to do to solve it.


Not everyone got a solution to this question. Several were not sure what to do or failed to use their knowledge to calculate accurately and as a result their solution were way out. 

But all of this provided some useful information - either confirming what I already suspected about each student or giving me an insight into the way they thought.

So....back to the report writing!